


The Midlands take the top two places in regional growth, both above 10%- London remains the region with lowest annual price growth at 0.6%
- Nottingham again heads the price-rise table in England at 23.7%
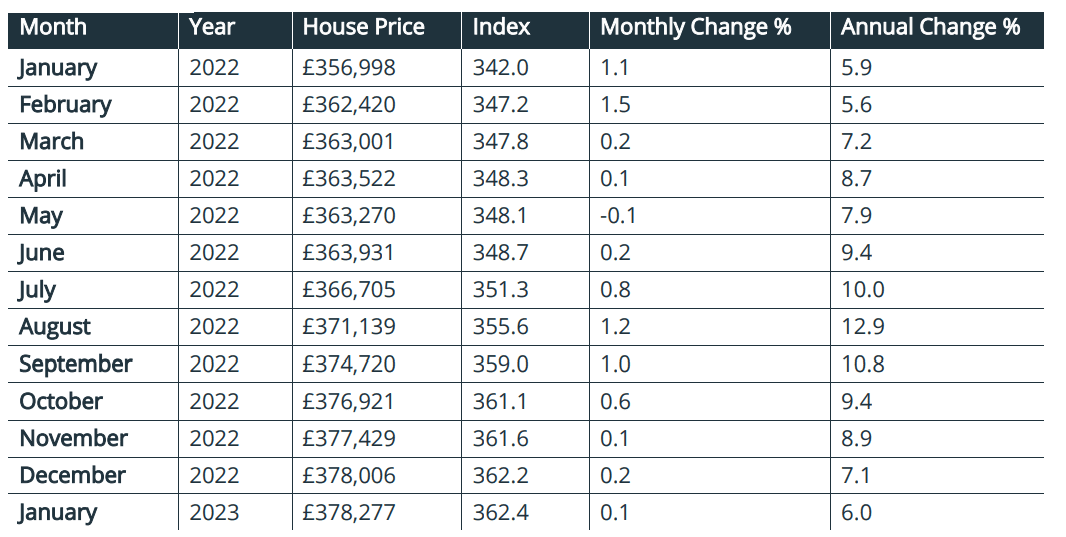
- Average House price now £378,277, up 0.1% on December, up 6% annually (up 7.9% annually excluding London and the South East)
Richard Sexton, director at e.surv, comments:
“Our data this month shows a slowing rate of growth, which will surprise no-one but nevertheless there is still modest growth, which is positive.
“It’s our view that while other commentators are comparatively downbeat about the future of the housing market, they are focused on specific elements. Mortgage borrowers, for example, are enduring significant increases in the cost of borrowing and this is curtailing their activity but since our index covers cash and mortgage transactions it does give a slightly different picture of what has been going on. Cash is a significant factor in some key housing markets.
“As a result of looking at whole of market activity rather than mortgaged transactions we can see that prices in January increased by £270, or 0.1%, which although very small is still positive. Indeed, we know that other sources too are suggesting things are slightly better than might otherwise be thought from the slew of negative headlines that have accompanied recent announcements. There is a wild variety of predictions with regard to property prices at the moment, but we err on the side of caution for now as the data suggests markets may be more robust than many suspect.
“What the data does tell us is that as an investment class of its own, property continues to perform well. Since the start of the pandemic in March 2020, prices to December 2022 have risen by some £65,500, or 21.0%, which contrasts with the increase in consumer price inflation (including housing – CPIH) of 15.4% over the same period.”
Table 1. Average House Prices in England and Wales for the period January 2022 – January 2023
Commentary: John Tindale and Peter Williams, Acadata Senior Analysts
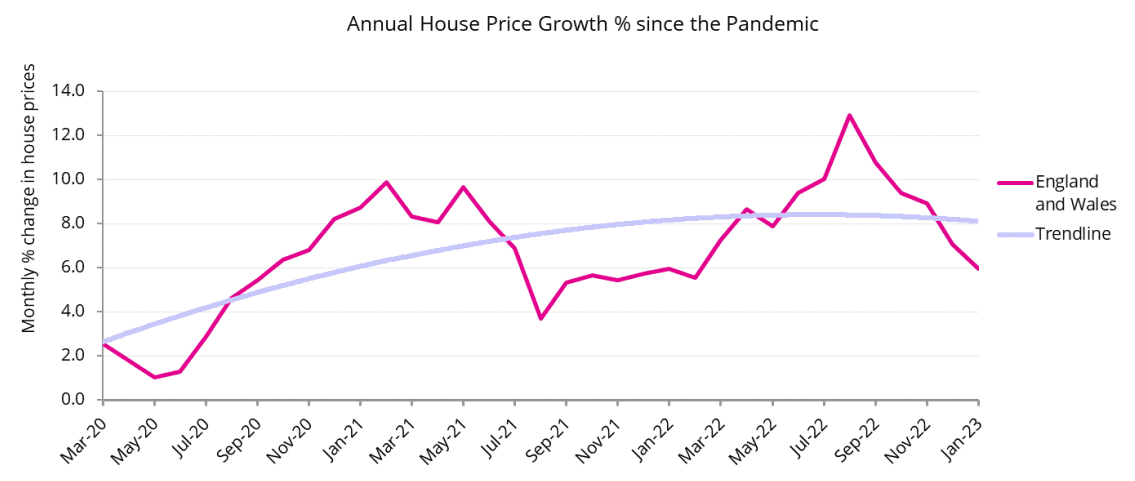
Figure 1. The average house price growth in England and Wales, March 2020 – January 2023
On an annual basis house prices recorded for completed transactions in England and Wales increased in January 2023 by some £21,300, or 6.0%. This is 1.1% lower than the 7.1% seen in December, and represents the fifth month in succession in which the annual rate of growth has slowed – a sustained downturn. However, even if the rate of price growth is slowing, prices are still increasing, and the current average price of £378,277 thus sets a new record level for England and Wales as a whole.
Since the start of the pandemic in March 2020, prices to December 2022 have risen by some £65,500, or 21.0%, which contrasts with the increase in consumer price inflation (including housing – CPIH) of 15.4% over the same period. Property prices have thus risen in real terms.
On a monthly basis, prices in January increased by £270, or 0.1%, which although very small is still positive. This suggests that falling prices are not an inevitable conclusion, as has been argued by some housing commentators. Indeed, as we observe on page 8, the Rightmove index is currently showing that new seller asking prices have risen by 0.9% (+£3,300) this month – this is the biggest increase at this time of year since 2020, as New Year sellers test the market.
The housing market in early 2023
Although there is evidence to suggest that we will see a continued weakening of the housing market in February, any attempt to take a longer forward view over the next 12 months remains clouded by the competing views and evidence which exist. Forward indicators such as the Bank of England mortgage approvals data for December 22 and the RICS housing market survey data for the same month both paint a relatively negative picture – mortgage approvals were down over 20% on the previous month (and around half of what they were in December 2021), while all the RICS net balance figures were similarly more negative. As shown below in the Comparison of Indices, both of the mortgage lender indices for January were also down. However, although there has been plenty of gloom about the economy in general, there is perhaps more to suggest that any downturn might be shorter rather than longer, and that interest rates might not go as high as some had predicted – as the dialogue surrounding the latest MPC committee meeting conclusions also suggests.
We are now just over 5 weeks away from the March 15th Budget, and all the signs are that it will contain some housing market initiatives as the government seeks to claw back public support. The Budget might therefore add further momentum to a somewhat more positive outlook, which in turn could mean that a longer and more damaging housing market downturn could be avoided. Interest rates, wages and unemployment will be the big drivers. Mortgage pricing has settled down, and market competition has intensified.
Our index, covering as it does cash and mortgage-based transactions gives a much fuller picture of the health of the housing market, not least because cash is very significant in a number of key markets. Moreover, falling prices – just as with rising prices – do mean that there is more negotiation between setting out an asking price and the final sale. At this point in the cycle, these are not insignificant factors to take account of.
Average Annual Regional House Prices
Figure 2. The annual change in the average house price for the three months from November 2022 to January 2023
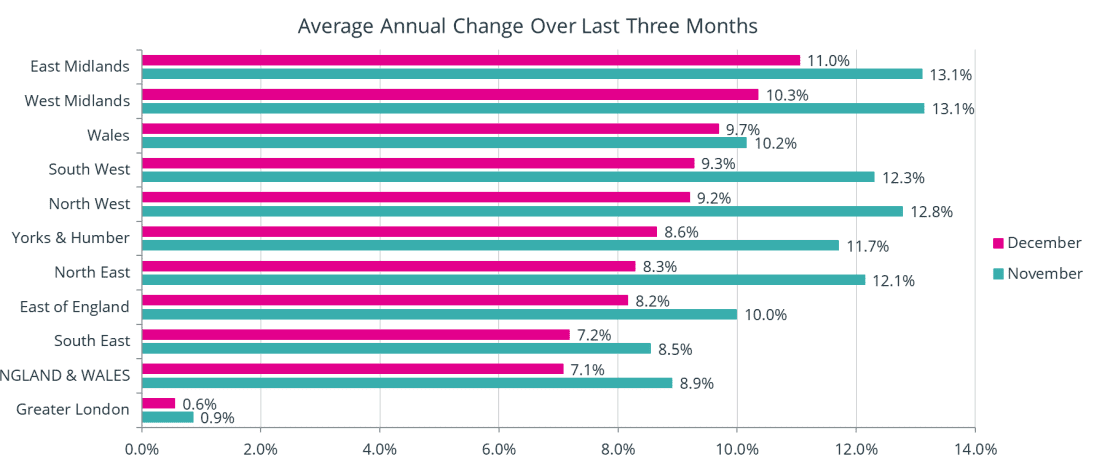
Figure 2 shows the percentage change in annual house prices based on completions on a regional basis in England and for Wales, averaged over the three-month period of November 2022 to January 2023, compared to the same three months in 2021/2022. These figures are produced on a rolling three-month basis to smooth out minor changes in price, and are centred on December (pink line), with Figure 2 also showing the similarly-averaged figures for November, one month earlier.
As can be seen, the changes in average house prices over the last twelve months in all ten GOR areas remain positive, although only just so in the case of Greater London, indicating that all countries and regions in England and Wales start with higher prices in 2023, compared with twelve months earlier.
However, since last month, the rate of change in the growth of house prices has diminished across all areas. The largest fall in the rate of price growth was in the North East, down 3.8% from 12.1% to 8.3%, followed by the North West, down 3.6% from 12.8% to 9.2%. The area with the lowest reduction in prices was Greater London, where price growth fell by just 0.3%, from 0.9% to 0.6%.
The East and West Midlands remain the top two regions (the same as last month), in terms of having the highest annual rates of price growth, at 11.0% and 10.3% respectively. In the East Midlands, six of its ten constituent unitary authority areas have price growth in excess of 10.0%, with the City of Nottingham setting the highest rate of annual growth in England at 23.7%.
The West Midlands region is in second place in Figure 2 above, a position it has held for the last six months, with the West Midlands unitary authority (which includes Birmingham) being its prime performer, having annual price growth at +13.8%.
By contrast, Greater London has the lowest annual growth rate of just +0.6%, although 19 of the 33 London boroughs saw prices rise on an annual basis (two less than last month). Broadly, the most expensive inner-city areas recorded falling values – impacting seven of the top ten boroughs ranked by price. For example, in the City of Westminster – which is ranked in second place in London in terms of its average value – house prices have fallen by -31.7% over the last twelve months, while in Kensington and Chelsea – the most expensive borough in London – prices fell by -12.8% over the same period. Meanwhile, 14 of the 16 lowest-priced London boroughs have seen their prices rise over the last twelve months, with Hounslow having the highest increase of this group, at 15.8%.
We should mention Wales in this section, as it has risen back up to third place in Figure 2, having held first position for eleven months from July 2021 to May 2022 before falling down the rankings. 21 of the 22 local authority areas in Wales are currently experiencing an increase in prices over the last twelve months, with only Pembrokeshire having a fall. Similarly, 10 of these 22 are currently at record price levels: this is perhaps surprising, given that prices were rising faster than in any English region during the first five months of 2022, and one might have thought that values would have started to falter after such a long period of high growth.
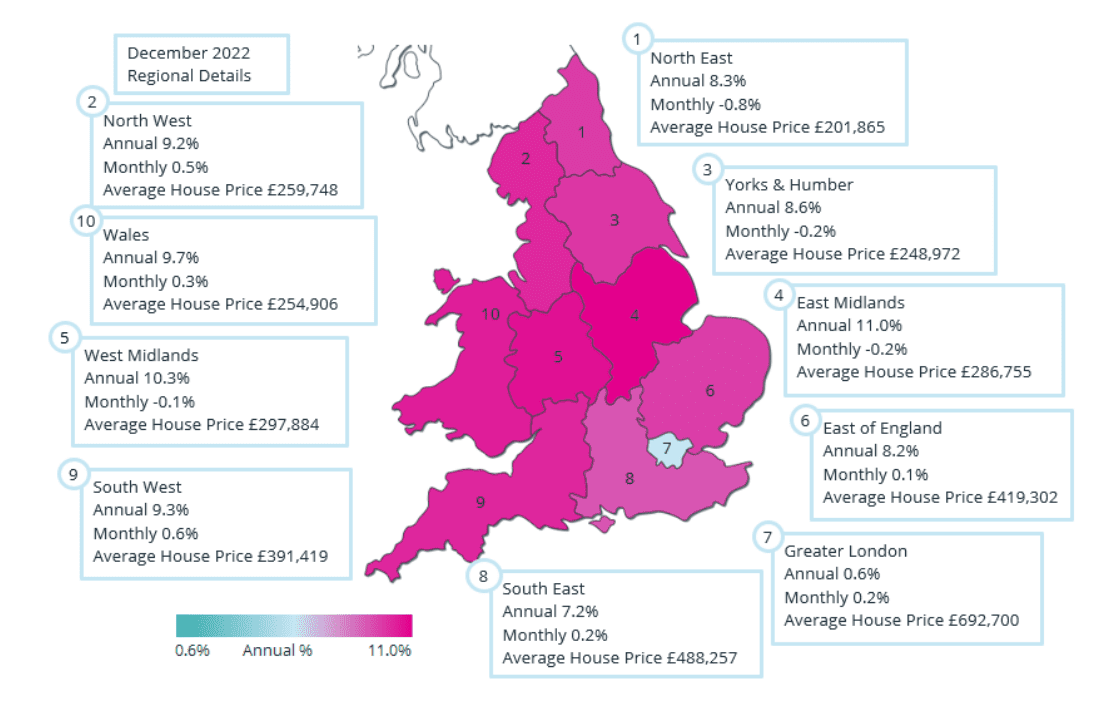
England and Wales Regional Heat Map
These different trends are then evident in the Regional Heat Map shown below for December 2022. There are three distinct groups in England and Wales in December 2022 in terms of house price growth. Three of the ten GOR areas in England and Wales are based across the centre of the map, being the East and West Midlands, plus Wales, all having rates of growth in excess of 9.5%. Then follow the areas to the north and south of these midland areas, with the exception of Greater London, where rates vary from 7.2% to 9.2. Finally, there is Greater London on its own, with an annual rate of just 0.6%.
Annual Growth Rate
The annual growth rate in the average completion-based house price recorded for England and Wales in January 2023 was 6.0%. This is 1.1% below the revised rate of 7.1% seen in December 2022, which itself was 5.8% below the 12.9% recorded in August 2022, hence demonstrating that annual rates of house price growth in England and Wales have been slowing since the summer months of 2022, and are now less than half of the rate seen at the peak of the recent growth in prices in 2022 – see Figure 1 above.
In December 2022, 109 of the 110 Unitary Authority areas in England and Wales were recording house price gains over the previous twelve months, indicating the extent to which price rises had been normalised across the two countries. The one area which failed to record a price increase over the year was Pembrokeshire in Wales, where prices fell by a marginal -0.7%. This position contrasts with Greater London, where 14 of the 33 boroughs witnessed declining prices over the year, with half of these 14 boroughs being in the top ten by average property values.
The area with the highest annual increase in prices in December, for the second month running, is Blaenau Gwent, at 31.2% growth – with the average price of detached homes increasing by £100k over the year to an average £334k – although this is based on only 12 properties. The second-placed authority is the City of Nottingham, with prices up by 23.7%. All property types in Nottingham have seen average price increases of £8,000 or more over the previous twelve months, with the average price of flats assisted this month by the sale of a £930k property in The Park area of the City, being the highest priced flat in Nottingham of the last twelve months.
Monthly Change
Average house prices increased by a marginal £270, or 0.1%, in January 2023. This represents a reduction of 0.1% from the 0.2% increase seen in December. However, small as it may be, the rise has still established a new record average price for England and Wales as a whole, at £378,277. We should not lose sight of the fact that at present average prices are still rising across England and Wales, even if, as highlighted below, some areas are beginning to experience price falls.
In fact, in December 2022, 56 of the 110 Unitary Authorities saw prices fall in the month, which is 17 more than one month earlier, indicating the widening extent of price declines across the country. The area with the largest fall in prices in December was Powys at -3.9%. In Powys, it is detached homes that have seen the largest fall in price. By way of contrast, the biggest price increase in the month was seen in Blaenau Gwent, a neighbouring area to Powys, where prices rose by 7.6%. This increase in price was assisted by the sale of a 6-bedroom detached property in Nantybwch, just outside the Brecon Beacons National Park, selling for £450k – the highest-priced home to be sold in Blaenau Gwent over the past five years.
6 of the 10 GOR areas in England and Wales saw prices increase during December 2022, compared to all 10 areas one month earlier. The four regions with price falls were the North East, (-0.8%), Yorkshire and the Humberside (-0.2%), the East Midlands (-0.2%) and the West Midlands (-0.1%).
Comparison of Indices
Figure 3. The monthly change in house prices January 2022 – January 2023
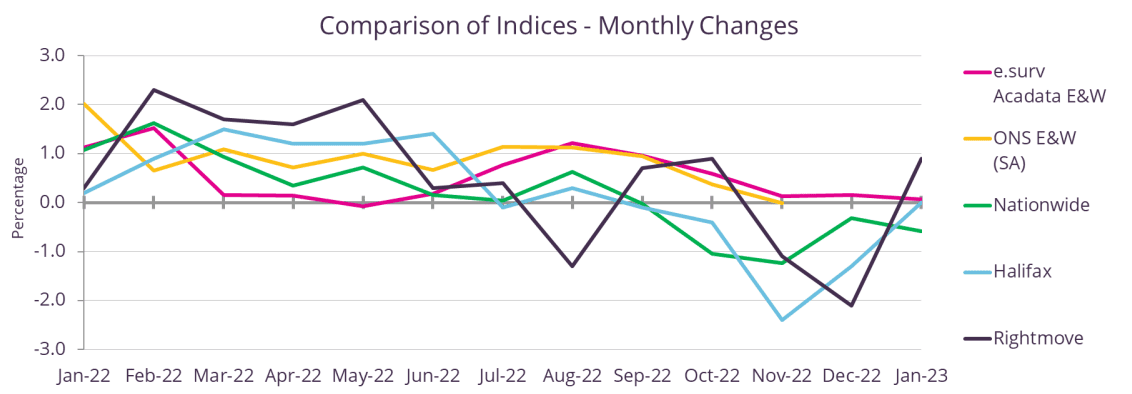
Last month we published our comparison of the annual rates of change in house prices of the five published national indices. This month we take a look at the monthly rates of these same five indices.
From around June 2022 onwards, the indices would appear to fall into three camps. In positive territory are the ONS and e.surv Acadata indices, which both use Land Registry data to compile their figures. These closely match each other, indicating that prices are increasing on a monthly basis from around 1.2% in August 2022, down to 0.1% for e.surv Acadata, or 0.0% for the ONS by November 2022 (the latest month published by the ONS).
The two lender indices – based on mortgage approval data (Halifax and Nationwide) – both dipped below the zero growth barrier in September 2022, with Halifax reaching a low of -2.4% in November 2022, and Nationwide a low of -1.2% in the same month. Halifax has subsequently climbed back up to 0.0% in January, although its standard price still fell in the month, albeit by a very marginal £30.
Meanwhile, Rightmove – which tracks market sentiment based on asking prices as opposed to achieved prices – fell to -2.1% in December, but has subsequently shown a new year bounce of +0.9% in January.
As we discussed last month, much of the difference in the indices’ rates is to do with the timing of the recorded price in the house buying process. Rightmove is quoting the price suggested by the seller at the time of putting the property on the market. The two lender indices use the price of the property at the time the buyer applies for a mortgage, which may still be subject to further negotiation, or cancellation. The ONS and e.surv Acadata indices on the other hand use the Land Registry date of the completion of the sale.
There is therefore, almost inevitably, a timing difference in the data under study, which is currently being exacerbated by the current delays in conveyancing. A delay of six months from a property first coming to the market to its eventual sale and contractual completion is not uncommon at the moment. The indices thus reflect the different timings in their compilation, and each have their own merits.
Housing transactions
Figure 4. The total number of housing transactions per month, January 2007 – November 2022
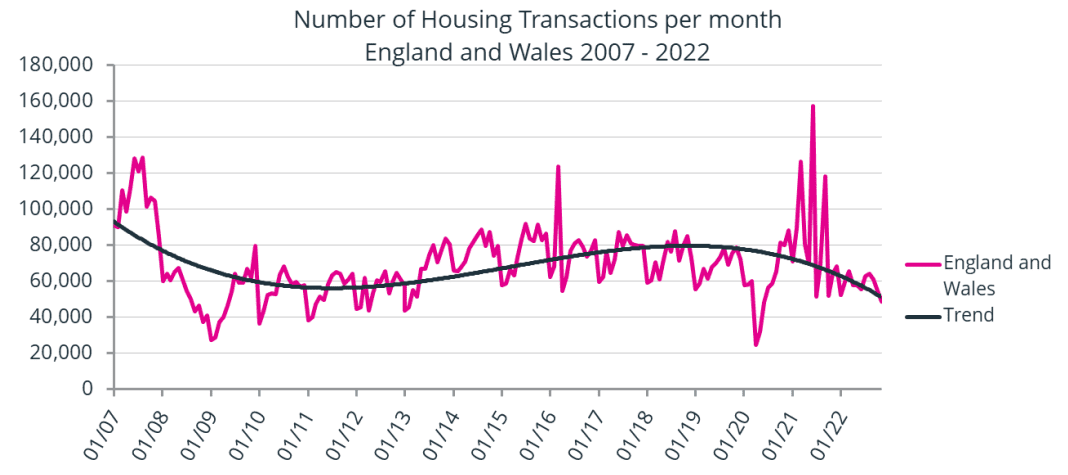
Figure 4 shows the total number of domestic property transactions per month recorded at the Land Registry for England and Wales, covering the period from January 2007 to November 2022.
As can be seen from Figure 4, the period from March 2020, at the start of the pandemic, until the end of 2022 has been far from normal in terms of property transactions. At the start of the pandemic, when the country was instructed to remain at home if not employed in an essential service, the number of property transactions slumped. Although property sales slowly increased during the remainder of 2020, the recovery was prolonged. Meanwhile, the Land Registry staff were working from home, which meant that the registration process took longer than normal.
During 2021, the Land Registry had the added problem of three peak months, of March, June and September, which were all tax-holiday related, and doubled or – in June – nearly tripled the volume of property registrations. The Land Registry, one year later, is still trying to catch up with the volume of sales presented.
This has had some repercussions as to the quality of the data which we use for our own Index. We are still receiving new data for 2021 and the first half of 2022, whereas in previous years, most sales data of this age would have been close to final. For example, this last month we have received data relating to 29 flats in the City of Westminster which were sold in March 2021 with an average price of £1.0 million each. Fortunately, this average price is close to normal for the City of Westminster, so it does not affect the statistics too much. However, we were also provided with information relating to 6 flats in the City of Westminster for January 2022, which included one flat priced at £20 million and another at £19 million. These two sales have raised the average price of flats in the City of Westminster for January 2022 by some £800k, which is the main reason why we are reporting a -31.7% fall in prices for the area in our latest London update.
At present, we are informed by the Land Registry that the registration of new-build properties in particular is behind their desired timescale. New-builds require significantly more work to register than a previously recorded property, as extra work is involved in setting out territorial boundaries, as well as working out and documenting the access to shared utilities such as mains water, sewage and electricity.
Transactions by property type
Figure 5. The number of housing transactions per month, January 2019 – November 2022, analysed by property type
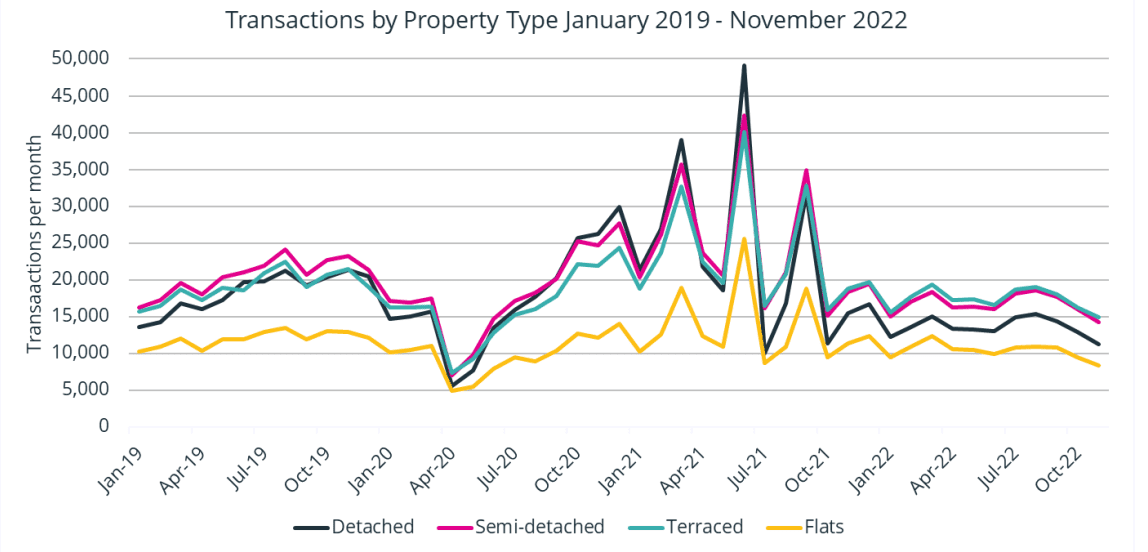
Figure 5 above analyses transactions for the period from January 2019 to November 2022 by property type. In general, transactions for each property type tend to move in similar directions to each other, with peaks and troughs tending to occur in the same months.
On closer examination, it can be seen that during 2019 and the first three months of 2022, the ranking in sales totals is headed by semi-detached, followed by terraces, detached and finally flats. However, from October 2021 onward the rankings change, with terraces outnumbering semi-detached sales, and the number of detached sales being visibly smaller than semi-detached during this latter period. Meanwhile, flats continue to trail the other three property types.
Help keep news FREE for our readers
Supporting your local community newspaper/online news outlet is crucial now more than ever. If you believe in independent journalism, then consider making a valuable contribution by making a one-time or monthly donation. We operate in rural areas where providing unbiased news can be challenging. Read More About Supporting The West Wales Chronicle


