Research by the estate agent comparison site, GetAgent.co.uk, has found that, despite a clear desire from homebuyers to live in areas of outstanding natural beauty, prices within the UK’s national parks have not necessarily gone up in the past year. While some parks have seen home values rise significantly, some have seen them fall by as much as -9.5%.
According to HM Land Registry, UK house prices have risen by an average of 10% in the last year and while there is general consensus that homes in more rural, countryside locations have risen more than those in cities, the new data shows that this rule is not universal.
GetAgent’s analysis monitors national park asking price growth based on property values within their respective postcodes.
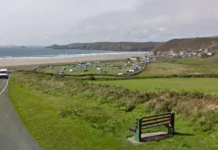
The most significant national park price growth has occurred along the Pembrokeshire Coast in Wales where an average of £35,108 has been added to house prices in the past year alone, with a 15.4% pushing the current average house price to £262,814.
The Lake District in Cumbria ranks second where house prices have risen from £287,486 to £320,208 in the last year, an 11.4% increase.
Snowdonia, Wales, has seen an average of £21,275 added to house prices in the past year, with an annual increase of 11.3%, while Exmoor and Brecon Beacons have also enjoyed impressive growth of 8.6% and 8.2% respectively.
However, while these national parks have seen significant growth, there are four national parks in the UK where prices have actually fallen over the past year.
In the Cairngorms in the Scottish Highlands, the average house price has fallen from £208,750 to £188,814, a surprising annual decline of -9.5%.
In the Yorkshire Dales, house prices have fallen from £307,270 to £289,899, a decline of -5.7%.
In Loch Lomond and the Trossachs, prices have fallen by -2.2% over the last year, while in Dartmoor prices are down -2.2%.
Founder and CEO of GetAgent.co.uk, Colby Short, commented:
“There’s no denying that many rural areas of the UK property market have seen a boost in buyer demand due to the great urban exodus spurred by a lengthy stint under lockdown restrictions.
But just because you own a home in an area of incredible natural beauty, it doesn’t necessarily mean you’ve seen a boost in the value of your home and in some cases, quite the opposite is actually true.
Of course, while a healthy level of house price appreciation is always a bonus, those looking to relocate to more rural climbs are less likely to be driven by a return on their investment and with such beautiful surroundings on their doorstep, who would be?”
| Table shows the average house price in each national park and the year on year change | ||||
| National Park | Average house price (June 2020) | Current average house price | Change £ | Change % |
| Pembrokeshire Coast | £227,705 | £262,814 | £35,108 | 15.4% |
| Lake District | £287,486 | £320,208 | £32,721 | 11.4% |
| Snowdonia | £188,001 | £209,277 | £21,275 | 11.3% |
| Exmoor | £279,385 | £303,386 | £24,001 | 8.6% |
| Brecon Beacons | £203,213 | £219,937 | £16,724 | 8.2% |
| North York Moors | £234,061 | £250,972 | £16,910 | 7.2% |
| The Broads | £281,450 | £296,501 | £15,051 | 5.3% |
| Northumberland | £227,443 | £236,405 | £8,962 | 3.9% |
| Peak District | £265,955 | £274,373 | £8,418 | 3.2% |
| New Forest | £425,738 | £433,412 | £7,674 | 1.8% |
| South Downs | £423,982 | £426,087 | £2,106 | 0.5% |
| Dartmoor | £284,865 | £279,280 | -£5,585 | -2.0% |
| Loch Lomond and The Trossachs | £190,540 | £186,443 | -£4,097 | -2.2% |
| Yorkshire Dales | £307,270 | £289,899 | -£17,371 | -5.7% |
| Cairngorms | £208,750 | £188,814 | -£19,935 | -9.5% |
| House price data sourced from PropertyData based on an average of all postcodes within each national park | ||||
Help keep news FREE for our readers
Supporting your local community newspaper/online news outlet is crucial now more than ever. If you believe in independent journalism, then consider making a valuable contribution by making a one-time or monthly donation. We operate in rural areas where providing unbiased news can be challenging. Read More About Supporting The West Wales Chronicle


