


106 of the 110 Unitary Authorities / Counties see prices rise in the month- North/South Regional price growth divide re-emerges, but due to different rates of change twelve months earlier
- South East and East of England gain higher % share of England and Wales market
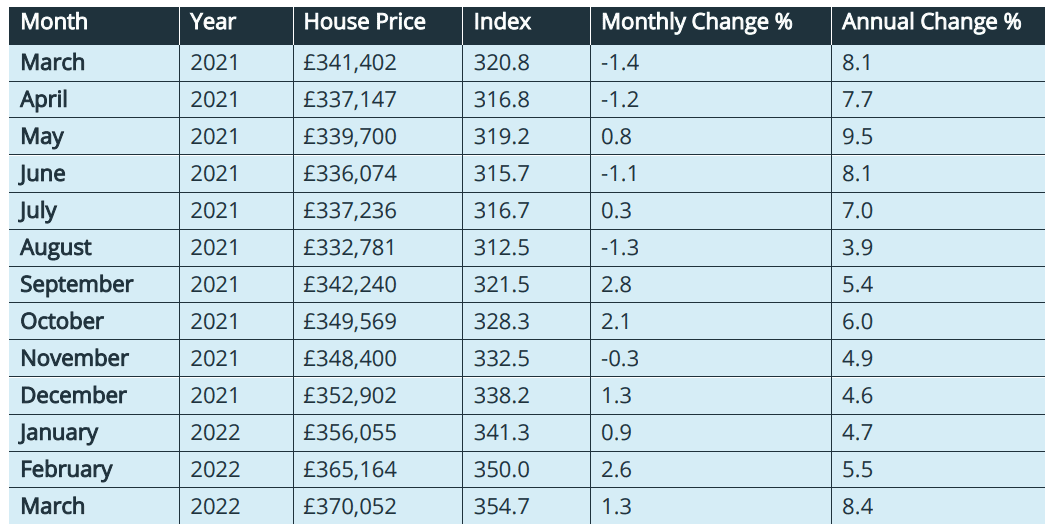
- Average house price now £370,052, March increase 1.3%, Annual increase 8.4%
Richard Sexton, director at e.surv, comments:
“Our index this month shows another new record level for England and Wales – and for the fifth time in the last twelve months. The average price paid for a home in England and Wales in March 2022 was £370,052, up some £4,900, or 1.3%, on the average price paid in February.
“Prices are now 8.4%, above March 2021 levels, and show a 2.9% increase over February 2022’s revised annual rate of 5.5% for homes bought with cash or a mortgage.
“The average house price in England and Wales has continued to increase throughout Q1 2022 on an almost straight-line basis.
“The strength of the market is underpinned by the continued limited supply and strong demand for space post the pandemic to meet our new expectations of how and where we live and work. This has been most visible for many months in the performance of Wales as a region but it is supported by the growth in the commuter belts of the South East which offer space but also proximity and good connections to urban centres for hybrid working.
“Ultimately low interest rates continue to support buyers’ affordability. The Bank of England has alluded to rates rising slowly in the face of economic headwinds. But inflation has traditionally signalled diminishing returns in other asset groups and often heralds a re-emergence in the popularity of bricks and mortar with investors. We may therefore see even more demand for those desirable properties that are coming to market.”
Table 1. Average House Prices in England and Wales for the period March 2021 – March 2022
Commentary: John Tindale and Peter Williams, Acadata Senior Analysts
Figure 1. The average house price in England and Wales, smoothed, March 2020 – March 2022

The average price paid for a home in England and Wales in March 2022 was £370,052, up some £4,900, or 1.3%, on the average price paid in February. This sets another new record level for England and Wales – and for the fifth time in the last twelve months, thus underlining the recent strength of the market. Prices are now £28,650, or 8.4%, above March 2021 levels, and show a 2.9% increase over February 2022’s revised annual rate of 5.5% for homes bought with cash or a mortgage.
The average house price in England and Wales has continued to increase throughout Q1 2022 on an almost straight-line basis, confounding commentators who had been expecting to see a slowing growth rate, as a result of increased cost of living pressures beginning to bear down on consumers. But as we show in this report, house prices throughout large swathes of England and Wales have continued to climb in 2022.
Average Annual Regional House Prices, Q1 2022
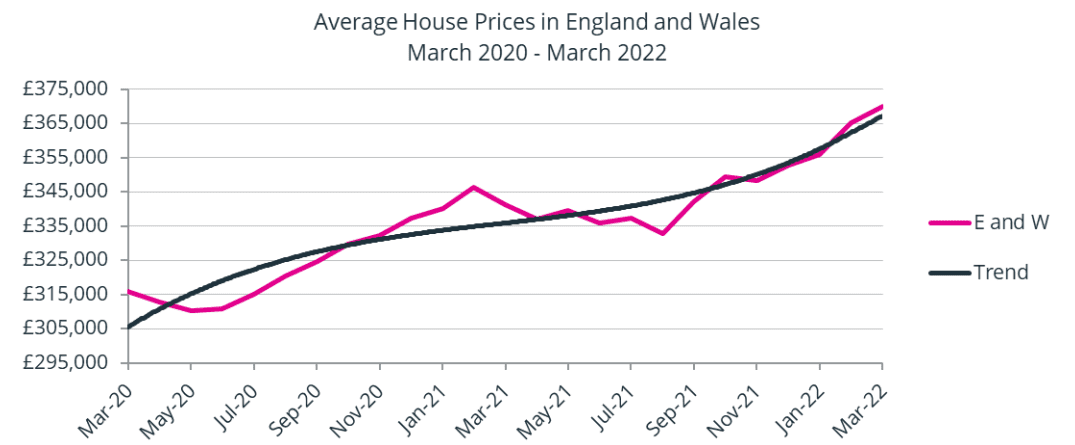
Figure 2 shows the percentage change in annual house prices on a regional basis in England, and for Wales, averaged over the three-month period of January to March 2022, compared to the same three months in 2021. These figures are produced on a rolling three-month basis with Figure 2 showing the similarly averaged figures from one month earlier.
Seven GOR areas have seen an increase in their annual rates of growth, compared to the previous month, while three areas experienced a fall. The three areas with a reduction in growth rates are all in the north of England, being, in descending order, the North East, at 2.2% – down from 3.0%, the North West, at 2.0% – down from 2.4%, and Yorkshire and the Humber, at 1.2% – down from 2.0%.
In February 2022, Wales is the GOR area with the highest annual growth rate, a position it has held for eight consecutive months. As discussed last month, Wales ticks all the boxes in terms of the adjusted ‘pandemic lifestyles’, with wide open countryside, scenic beauty spots and attractive coastal locations, as well as the second-lowest average house prices of the ten GOR areas in England and Wales.
In second place in terms of house price growth is the South East, which was also discussed in some detail in last month’s report. It was suggested that the South East is currently experiencing strong demand for large properties from those who want a change in ‘lifestyle’, but who also want a reasonable commute into London as and when required, to suit the new hybrid work patterns of visiting the office on a reduced number of days per week. We noted that locations such as Woking, Sevenoaks and Epsom and Ewell were experiencing strong demand for properties due to their efficient rail services into London Termini.
In third place is the South West, where Bournemouth has witnessed 19.4% price growth over the previous twelve months – the highest rate of the 110 Unitary Authorities/Metropolitan Counties that we monitor (the results of this analysis are published on the Acadata website).
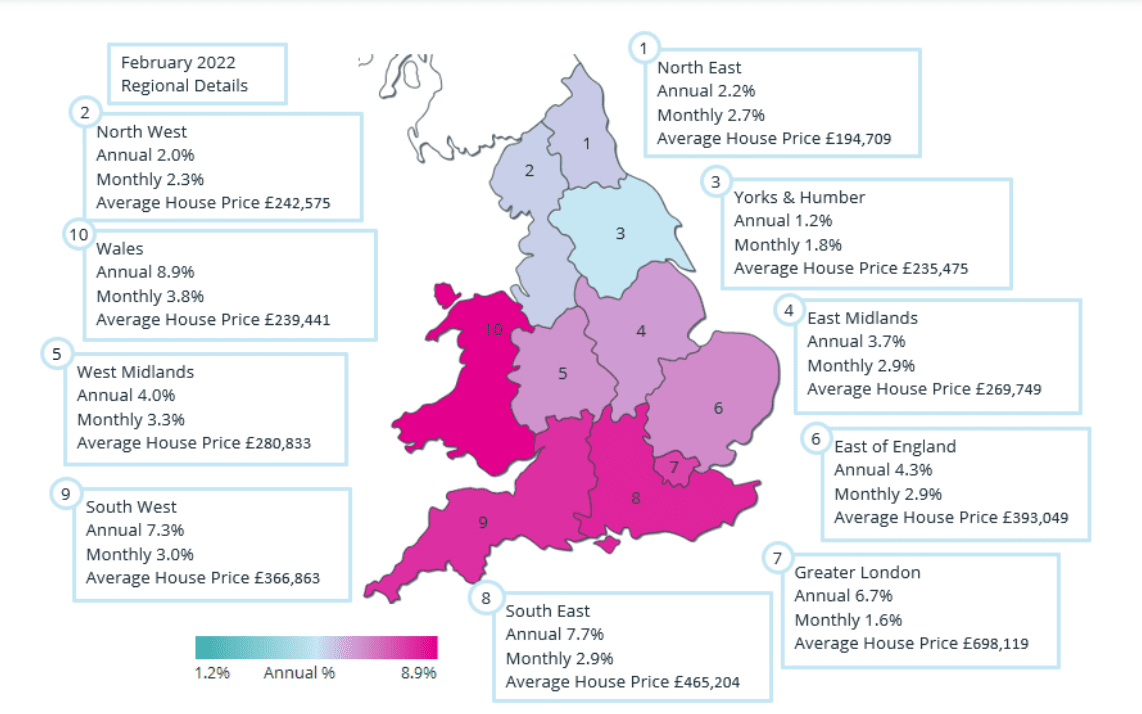
England and Wales Regional Heat Map for Q1 2022
These different trends are evident in the Regional Heat Map shown below for Q1 2022. There are four distinct areas in England and Wales in terms of house price growth. In the hot-spot is Wales, where annual price growth is at 8.9% – this is 1.2% higher than the next GOR area of the South East.
The South East is then grouped with the South West and Greater London to form a more general “South of England”, where prices are rising between 6.7% and 7.7% per annum.
The next group is the “Midlands”, consisting of the East and West Midlands, to which is added the East of England, where prices are rising between 3.7% and 4.3%.
Finally, we have the “North” of England, consisting of the North East, the North West and Yorkshire and the Humber, where prices are rising by less than 2.5%.
This overall pattern is almost a total reversal of that seen in Q2 2021, when the northern regions – plus Wales and the South West – were in the ascendancy in terms of house price growth, while the southeast corner of England had the lowest growth rates.
The housing market in early 2022
With stock levels of homes for sale still remaining relatively low, there is inevitably pressure on prices for those households wanting to buy, and this has contributed to the continued price rises. And, whilst some might consider this could affect market activity, it seems buyers (and indeed sellers) might have been waiting to see what happens and may well have taken the decision to push on, and not least to take advantage of the spring season when the market is typically at one of its most active periods of the year.
March – Annual & Monthly Price Trends
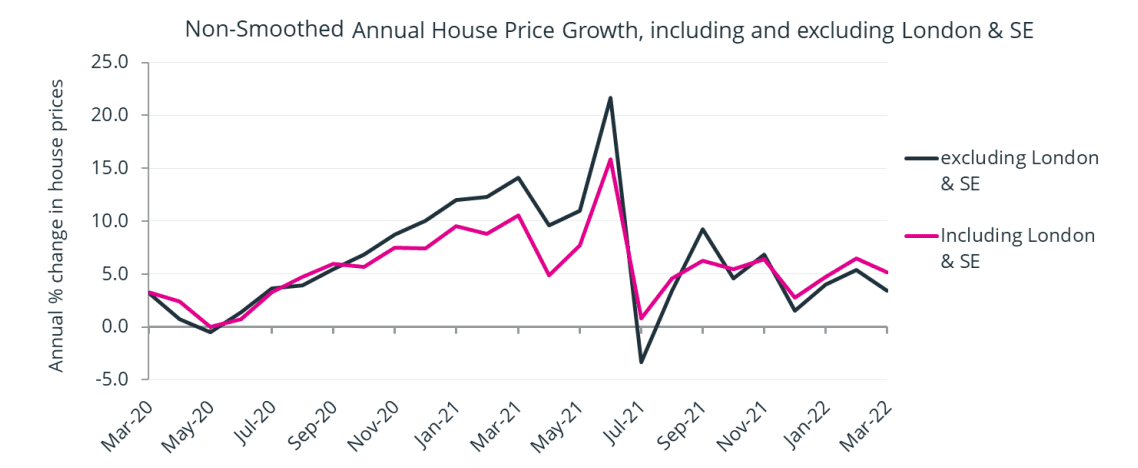
Figure 3 shows the annual growth rates in house prices over the last two years, one plot including Greater London and the South East, along with the remainder of England and Wales (the red line), and the other excluding Greater London and the South East (the blue line). As we discussed last month, the impact in the previous period from September 2020 to July 2021 can clearly be seen. This roughly approximates to the time when the SDLT tax holiday was operational in England, and the LTT tax holiday was applicable in Wales.

| [donate]
| Help keep news FREE for our readersSupporting your local community newspaper/online news outlet is crucial now more than ever. If you believe in independent journalism,then consider making a valuable contribution by making a one-time or monthly donation. We operate in rural areas where providing unbiased news can be challenging. |


