


Ninth month of falling annual rate of house price growth- Fifth month of falling prices paid for homes
- Average price still £ 7,360 ahead of twelve months earlier
- The North East takes top place in regional growth at 5.3%
- Commute times becoming more significant in buying decisions
- Average house price £373, 066 in England and Wales, down 0.2% on April, up 2% annually
Richard Sexton, Director at e.surv, comments: “Of note this month is that the average house price fell by £814, or -0.2%, in May 2023. It is the fifth month in succession in which the average price paid for a home has fallen, making the total reduction in 2023 some £6,000. The trend is more material at the moment than the decrease itself as prices in 2022 on average gained £23,250 – almost 50% of the total average gain since 2020 of £58,000.
“For now this should be of some comfort to those worrying about negative equity. We are not building enough homes and while we have strong employment we would expect prices to be resilient.
“The cloud on the horizon is inflation which remains stubbornly high. Indeed stagflation is probably the greatest risk facing the UK economy. More interest rate rises are likely and this impacts affordability through higher mortgage rates.
“To see the impact of inflation to date, we need only look at the average interest rate on a two-year fixed rate mortgage which now stands at over 5.5% based on 75% Loan to Value. The mortgage market is pricing in a rise in the Base Rate in June which will further hamper many trying to move in what is traditionally a very busy time of the year for the housing market. Looking further forward, the market is now expecting the Bank of England base rate to peak at just over 5% by the end of 2023.
“Affordability, together with a lack of supply of the right kind of property, is now the key force shaping the housing market. Our prognosis is that house price inflation will continue to reduce albeit modestly without fiscal intervention and we expect buyers to be cautious and sellers become less ambitious.”
Table 1. Average House Prices in England and Wales for the period May 2022 – May 2023
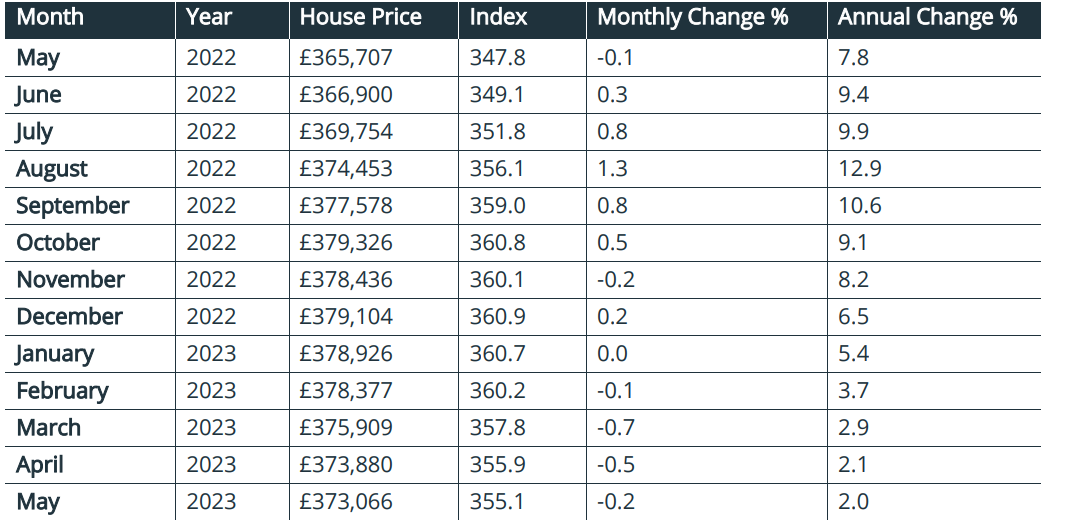
Note: The e.surv Acadata House Price Index provides the “average of all prices paid for domestic properties”, including those purchases made with cash.
Commentary: John Tindale and Peter Williams, Acadata Senior Analysts
Figure 1. The average house price growth in England and Wales, May 2021 – May 2023
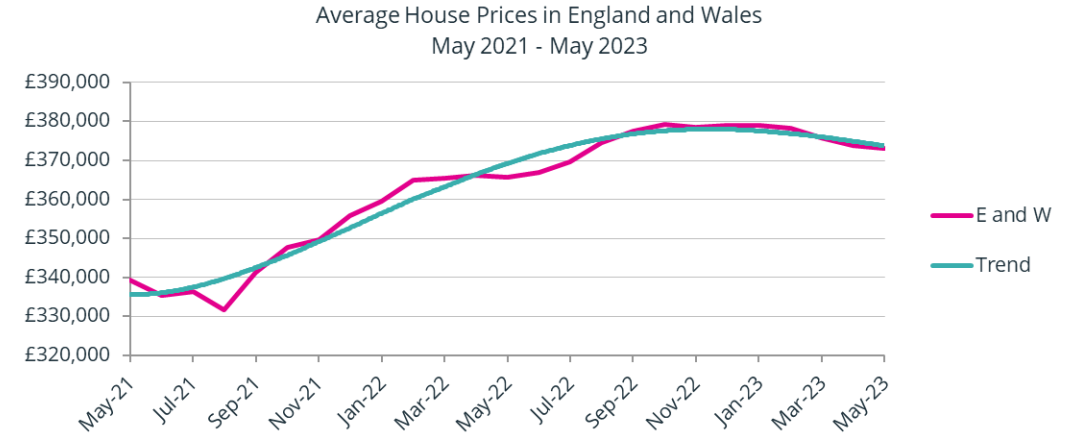
On an annual basis, the average sale price of completed home transactions in England and Wales in May 2023 rose by some £7,360, or 2.0%. This is the lowest rate of annual increase since June 2020, and is the ninth month in succession in which the annual rate of price inflation has fallen. On a monthly basis, the average price fell in May 2023 by some £800, or -0.2%. In the transactions calendar, May tends to indicate the start of the summer season when sales reach their maximum, with buyers as well as sellers active in the market. Here we can see that both annual and monthly rates show evidence of continuing reductions in price growth, despite seasonal adjustment.
However, as Figure 1 illustrates in terms of actual nominal prices, the fall in price since its peak in October 2022 of £6,260 is still relatively minor, especially when compared to the cumulative near £41,360 rise in prices since August 2021 – the low point on the graph. In fact, prices have risen by around £58,000, or 18%, since the start of the pandemic in March 2020 – so some perspective is required when commenting on the extent of the current price falls.
The housing market in May 2023
Once again events have confounded the market. Expectations that interest rates had come close to peak were dashed when the Bank of England raised its rate by 0.25% to 4.5% on May 11th, and signalled that further rate rises were likely. The market has now priced in a rise to 5.5%, and a consequence of this has been the rising cost of the swap rates used to price fixed-rate mortgages. Lenders have been withdrawing products and repricing those that remain – partly to avoid being swamped by demand from those borrowers seeking to fix their rates before any further BoE rises (the Bank’s MPC is next due to meet on 22nd June).
This market turbulence has inevitable consequences. Not only are some borrowers finding it harder to obtain a mortgage, but many more are facing rapidly rising mortgage costs, not least as much cheaper fixed-rate deals agreed before or during the Covid pandemic – when rates were considerably lower – come to an end.
Little wonder then that house price inflation has continued to reduce. There is inevitable caution by buyers, given the continued drift in prices and the possible rate pressures. Sellers too have reduced their ambitions, partly because they recognise the gains made over previous years. There is a market expectation that prices will continue to slide, albeit to a more modest degree than some commentators had suggested at the turn of the year. Our data suggests that the rate of decline may be slowing, and that if the economy continues to avoid recession and price inflation falls away, that there then may be grounds for a little more optimism. Certainly, the GfK consumer confidence index in May shows a continuing positive trend.
Mortgage approvals in April were down on March, which corresponds with the broad trends discussed above. Similarly, mortgage arrears have risen slightly – as reported by UK Finance – seemingly as a consequence of cost of living pressures (and the rise is on the back of historic lows). Without doubt, there is considerable consumer pain in the housing market, but to date most households seem to be weathering the storm. Much will depend on the future course of interest rates, as well as trends in the wider economy.
Average Annual Regional House Prices
Figure 2. The annual change in the average house price for the three months from March to May 2023, analysed by GOR
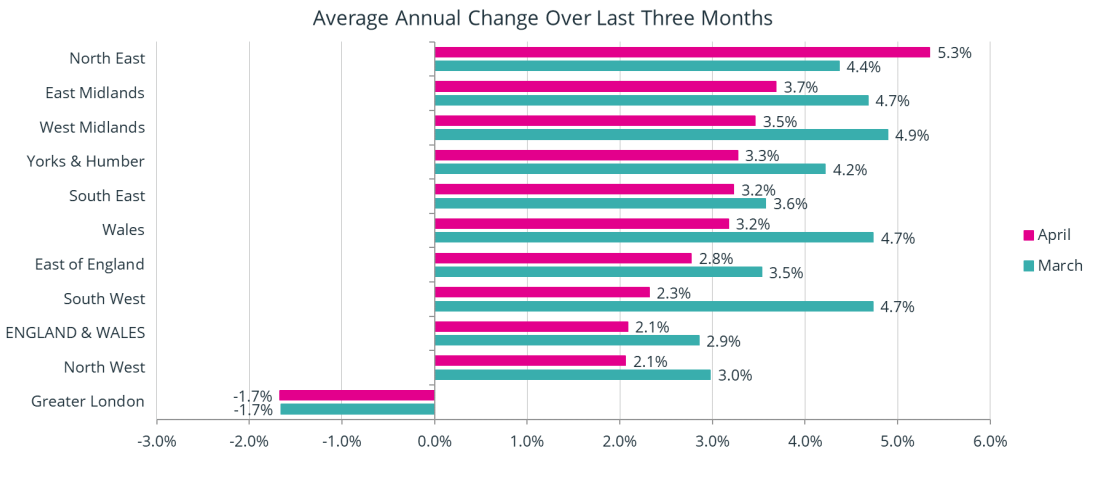
Figure 2 shows the percentage change in annual house prices on a regional basis in England and for Wales, averaged over the three-month period of March to May 2023, compared to the same three months in 2022. These figures are calculated on a rolling three-month basis to smooth out the minor changes in price which almost inevitably arise, and are centred on April 2023 (pink line), with Figure 2 also showing the similarly-averaged figures for March 2023, one month earlier (blue line). The Acadata prices are also adjusted for seasonal variation.
As can be seen, the changes in average house prices over the last twelve months remain positive in nine of the ten GOR areas, with Greater London being the only area where prices have fallen over the period. However, all ten regions now have a rate of growth of 5.3% or less – just three months earlier, in January 2023, the highest regional rate was nearly 4% above this, at 9.1%.
Since last month, the rate of growth of house prices has slowed in eight of the ten regions, with only the North East and Greater London seeing a higher or the same growth rate this month (April) compared to last. The largest fall was in the South West, down by 2.4% from 4.7% to 2.3%, followed by the West Midlands, down 1.4% from 4.9% to 3.5%.
This month the North East takes top place in terms of price growth, at 5.3%. This is the first time that the North East has held the top position of the ten GOR areas since December 2010. There are three Unitary Authority areas in the North East with price growth in excess of 9.0%, being Hartlepool, Stockton-on-Tees and Tyne and Wear, with annual price growth of 10.8%, 9.5% and 9.1% respectively.
In second place this month is the East Midlands, with 3.7% growth, having pushed the West Midlands into third position. In the East Midlands, there are three local authority areas with price growth in excess of 7%, these being the City of Nottingham (9.5%), Leicester (8.4%) and Nottinghamshire (7.6%).
As already noted, Greater London is the only GOR area with negative growth, at -1.7%, the same level as in the previous month. In April 2023, 17 of the 33 London boroughs saw prices rise on an annual basis (the same number as in the previous month). However, generally it continues to be the most expensive inner areas that are recording falling prices – again impacting eight of the top ten boroughs ranked by price. For example, in the City of Westminster – which is ranked in second place in London in terms of its average value – house prices have fallen by a third over the last twelve months, with its current average price of £1,270,000 being £1 million less than the highest average price which was achieved in February 2022. Meanwhile in Kensington and Chelsea – the most expensive borough in London – prices fell by -20.1%. 11 of the 17 lowest-priced London boroughs have seen their prices rise over the last twelve months, the six exceptions being Tower Hamlets (-9.1%), Newham (-7.5%), Southwark (-5.6%), Greenwich (-5.0%), Enfield (-4.6%) and Bromley (-1.5%). Tower Hamlets has the second-highest proportion of flat sales of the 33 boroughs in Greater London, at 93%.
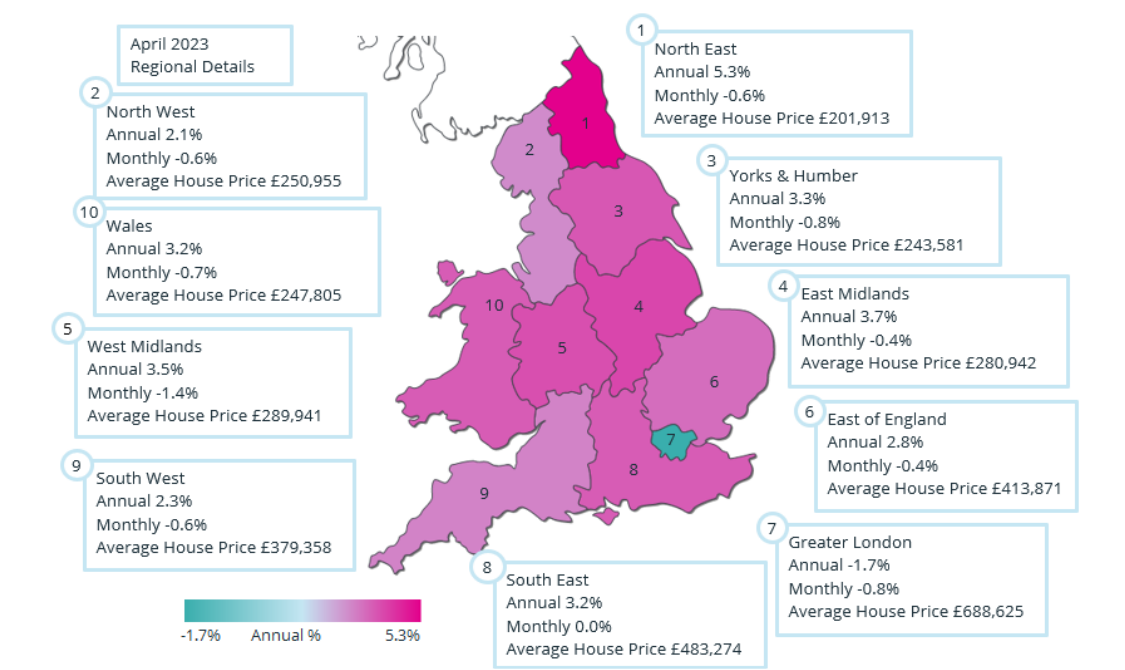
England and Wales Regional Heat Map
These different trends are evident in the Regional Heat Map shown below for April 2023.
There are perhaps four groups in England and Wales in April 2023 in terms of house price growth. The first is the North East – out on its own – with a rate of 5.3%, followed by five areas with price growth of 3.2% or higher, being the East and West Midlands, Yorkshire and the Humber, the South East and Wales. There then follow three regions where price growth lies between 2.1% and 2.8%, which are the East of England, the South West and the North West. Finally, there is Greater London also on its own, with prices falling on an annual basis by -1.7%.
Annual Growth Rate
The annual growth rate in England and Wales in May 2023, for both mortgage and cash-based house purchases, was an arithmetic average of 2.0%. This is 0.1% below the revised rate of 2.1% in April 2023 and represents the ninth month in succession in which the annual rate of house price growth has slowed from the +12.9% seen in August 2022. It is however the smallest reduction in these nine months, perhaps suggesting a slowing in the rate at which house prices are falling.
In April 2023, 91 of the 110 Unitary Authority areas in England and Wales were still recording house price gains over the last twelve months, indicating the wide extent of price rises that had taken place across the two countries, even if the growth rate is now diminishing. This does however contrast with the 104 authorities that saw prices rise on an annual basis in March – annual gains are therefore diminishing.
The area with the highest annual increase in prices in April 2023 is Windsor and Maidenhead, at 13.5% growth – the average price being assisted this month by the sale of a five-bedroom detached home overlooking Cookham Dean Common for £2.5 million. Cookham railway station is 1 mile away from this property, from where there is an 8-minute train journey to Maidenhead. Maidenhead is of course on the new Elizabeth Line as well as the GWR railway, which as we reported last month has a typical 25-minute rail link into Paddington – all highly commutable.
By way of contrast, the Unitary Authority area with the largest fall in prices over the last twelve months is Bracknell Forest, at -8.9%. All property types in Bracknell Forest have seen reductions in their average prices over these last twelve months, despite being only 10 miles away from Cookham Common, as described above. Could this be due to the over-long commute time of 1 hour 5 minutes from Bracknell Station to London Waterloo? Working from the office is again becoming an important influence in property location, with London commute times once again emerging as a significant factor.
Monthly Change
Average house prices fell by £814, or -0.2%, in May 2023. This was the fifth month in succession in which the average price paid for a home has fallen, making the total reduction in 2023 some £6,000. However, this total needs to be contrasted with the £23,250 gain in prices in 2022, and the near £58,000 increase in prices that has taken place since the start of the pandemic in March 2020 – most homeowners are therefore still likely to have gained considerably more equity in their property over this period, despite the recent price falls.
In April 2023, prices rose on a monthly basis in 46 of the 110 Unitary Authorities, which is 9 more than in March, suggesting a more positive environment than earlier this year. The area with the greatest increase in prices in April was Rutland, up by 4.4% in the month – however Rutland has the lowest transaction count of all the 110 Unitary Authorities that we monitor, which tends to produce volatile movements in its average price: for example in April 2023, only 14 property sales had taken place. The authority with the second-highest price growth in April was Brighton and Hove, up by 3.3% in the month. In Brighton and Hove in April all property types saw an increase in their values, with terraces seeing the largest increase, enhanced by the sale of a Victorian 3-bed terraced property in Preston Park, for £1 million.
The South East was the only GOR area in England and Wales which saw prices increase during April 2023, up by a tiny £105, whereas in March the only area to see prices rise in the month was the North East. In the South East, in April, the areas with the highest increase in prices in the month were Brighton and Hove (+3.3%), Slough (+2.1%) and Windsor and Maidenhead (+1.8%). It can be noted that both Maidenhead and Slough are located on the cross-London Elizabeth Line.
Comparison of Indices
Figure 3. The monthly change in house prices May 2022 – May 2023
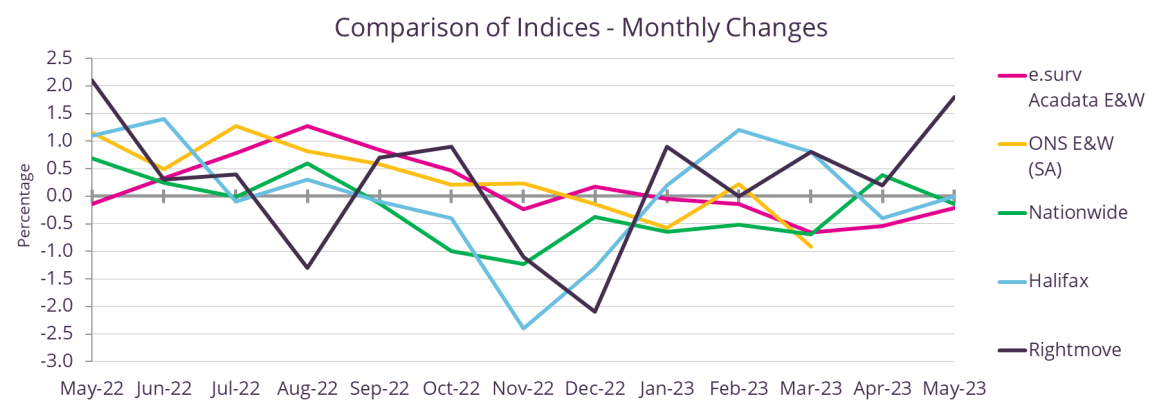
This month in Figure 3 we comment on the Monthly – as opposed to last month’s Annual – rate of change in house prices as measured by the five different index providers listed to the right of the graph, for the period May 2022 to May 2023. In general, the monthly rates of change are more volatile than the annual rates and tend to be more divergent one from another.
Nevertheless, the range in the rates of growth was at its minimum in April 2023, at just 0.9%, with Nationwide reporting 0.4%, while e.surv Acadata was indicating -0.5%. However, that convergence in rates fell away one month later in May 2023, with Rightmove reporting an increase of 1.8% in the month, contrasting with e.surv Acadata’s monthly rate of -0.2%.
Rightmove itself advises: “This 1.8% monthly increase is the biggest of the year so far, and is significantly higher than the historic average May rise of 1.0%”. The Rightmove index tends to measure market sentiment, as it is based on the sellers’ asking prices, as opposed to the prices actually achieved in the market place. One should also perhaps note that Rightmove reports halfway through each month as opposed to at the end of the month – and certainly in May 2023 consumer sentiment slid downwards towards the end of the month, as mortgage providers withdrew their lowest competitive rates. It can therefore be anticipated that Rightmove’s June 2023 monthly rate will show a decline from its current high levels.
If we put Rightmove to one side, then the remaining indices are showing close proximity to each other, with e.surv Acadata at -0.2%, Nationwide at -0.1% and Halifax at 0.0%.
There are three main reasons why these price indices differ from each other. The first is to do with the timing of obtaining the price data in the home purchase timeline. Rightmove is the earliest, since it measures its data at the point when a seller first places the property on the market. It is an asking price, and depending upon the state of the market, negotiations will follow – up or down reflecting local demand. The two lender indices base their data on prices being notified as the application for a loan reaches the mortgage approval stage. Finally, e.surv Acadata and the ONS both use Land Registry data, which dates the sale at the time of contract completion. This is the final sales price.
The second difference is that the ONS, Rightmove and e.surv Acadata will be recording both cash and mortgage-based purchases while, by definition, the lenders only record the prices on their own loan-based transactions. Finally, e.surv Acadata and the ONS use all the domestic transactions recorded at the Land Registry, while the lender indices may well have policies in place, such as not lending on homes with a price in excess of £X million, which could introduce a slight bias into their results.
Each has its own merits, but it is useful to understand the differences in order to better appreciate what the indices are showing and why they differ.
Housing transactions per month
Figure 4. The total number of housing transactions per month, January 2007 – April 2023
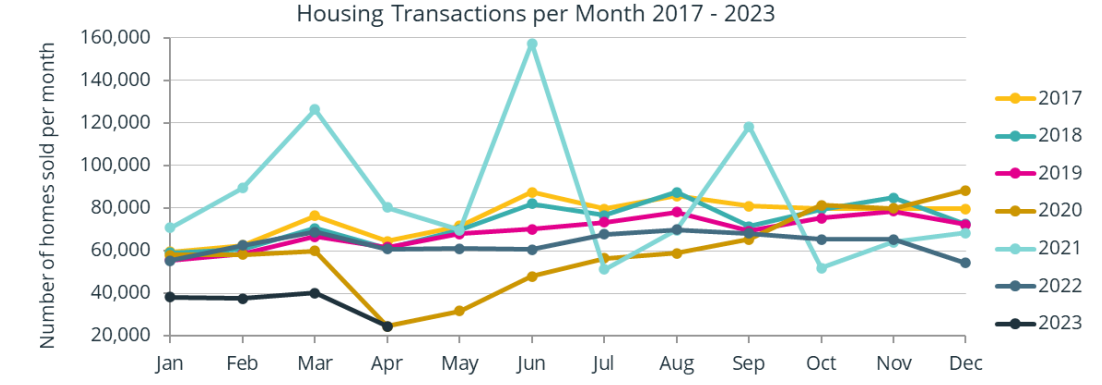
Figure 4 shows the total number of domestic property transactions per month recorded at the Land Registry for England and Wales, covering the period from January 2017 to April 2023.
There are four years of particular interest in Figure 4. The first is the light brown line of 2020. This year began with an average 58,640 transactions in the first three months, up to the start of the pandemic, which was announced during the later part of March 2020, when households were instructed to remain at home (if not employed in an essential service). The announcement came too late to affect March sales, but in April 2020, the number of property transactions slumped to 24,560. Although property sales slowly increased during the remainder of 2020, the recovery was prolonged.
During 2021, the light blue line, the housing market was transformed, in part due to the tax-holidays that were made available in both England and Wales, and in part owing to the change in attitude brought about by working from home coupled with the desire for more space. Three spikes are clearly visible in March, June and September 2021, which were all tax-holiday related. The number of transactions per month in England and Wales in 2021 averaged some 84,800 sales.
By contrast 2022, the grey line, proved to be a far more subdued and stable year than 2021, with transactions returning to an average 63,300 sales per month – slightly ahead of the levels seen in 2020. The reduction in sales from September 2022 onward is visible, coinciding with both the arrival of Mrs Truss as Prime Minister on 6 September 2022 and the sixth increase in the official bank rate, to 2.25%, on 22 September 2022. Liz Truss departed as Prime Minister on 25th October 2022. The bank rate was further increased on 3rd November and 15th December 2022, ending the year at 3.5%. Housing sales in December 2022 totalled 54,200 – the lowest December total on the graph.
2023, the black line, has only seen an average of 35,100 sales per month – the lowest level of these four months since the banking crisis of 2009 – but the data for these months is still emerging, so these totals will slowly increase over time.
Help keep news FREE for our readers
Supporting your local community newspaper/online news outlet is crucial now more than ever. If you believe in independent journalism, then consider making a valuable contribution by making a one-time or monthly donation. We operate in rural areas where providing unbiased news can be challenging. Read More About Supporting The West Wales Chronicle


